Municipal Finance Lab
ERD & Data Modeling Study Guide
A printable guide for studying table relationships, grain, fact and dimension thinking, business rules, and SQL analysis questions when you do not feel like doing a full lab.
How to use this guide
Read one section at a time. The goal is not to memorize the diagram. The goal is to practice seeing how tables connect to business questions.
On low-energy days, pick one reflection question, write a few lines, and stop there. That still counts as practice.
Reference Visual
Municipal Finance ERD Learning Canvas
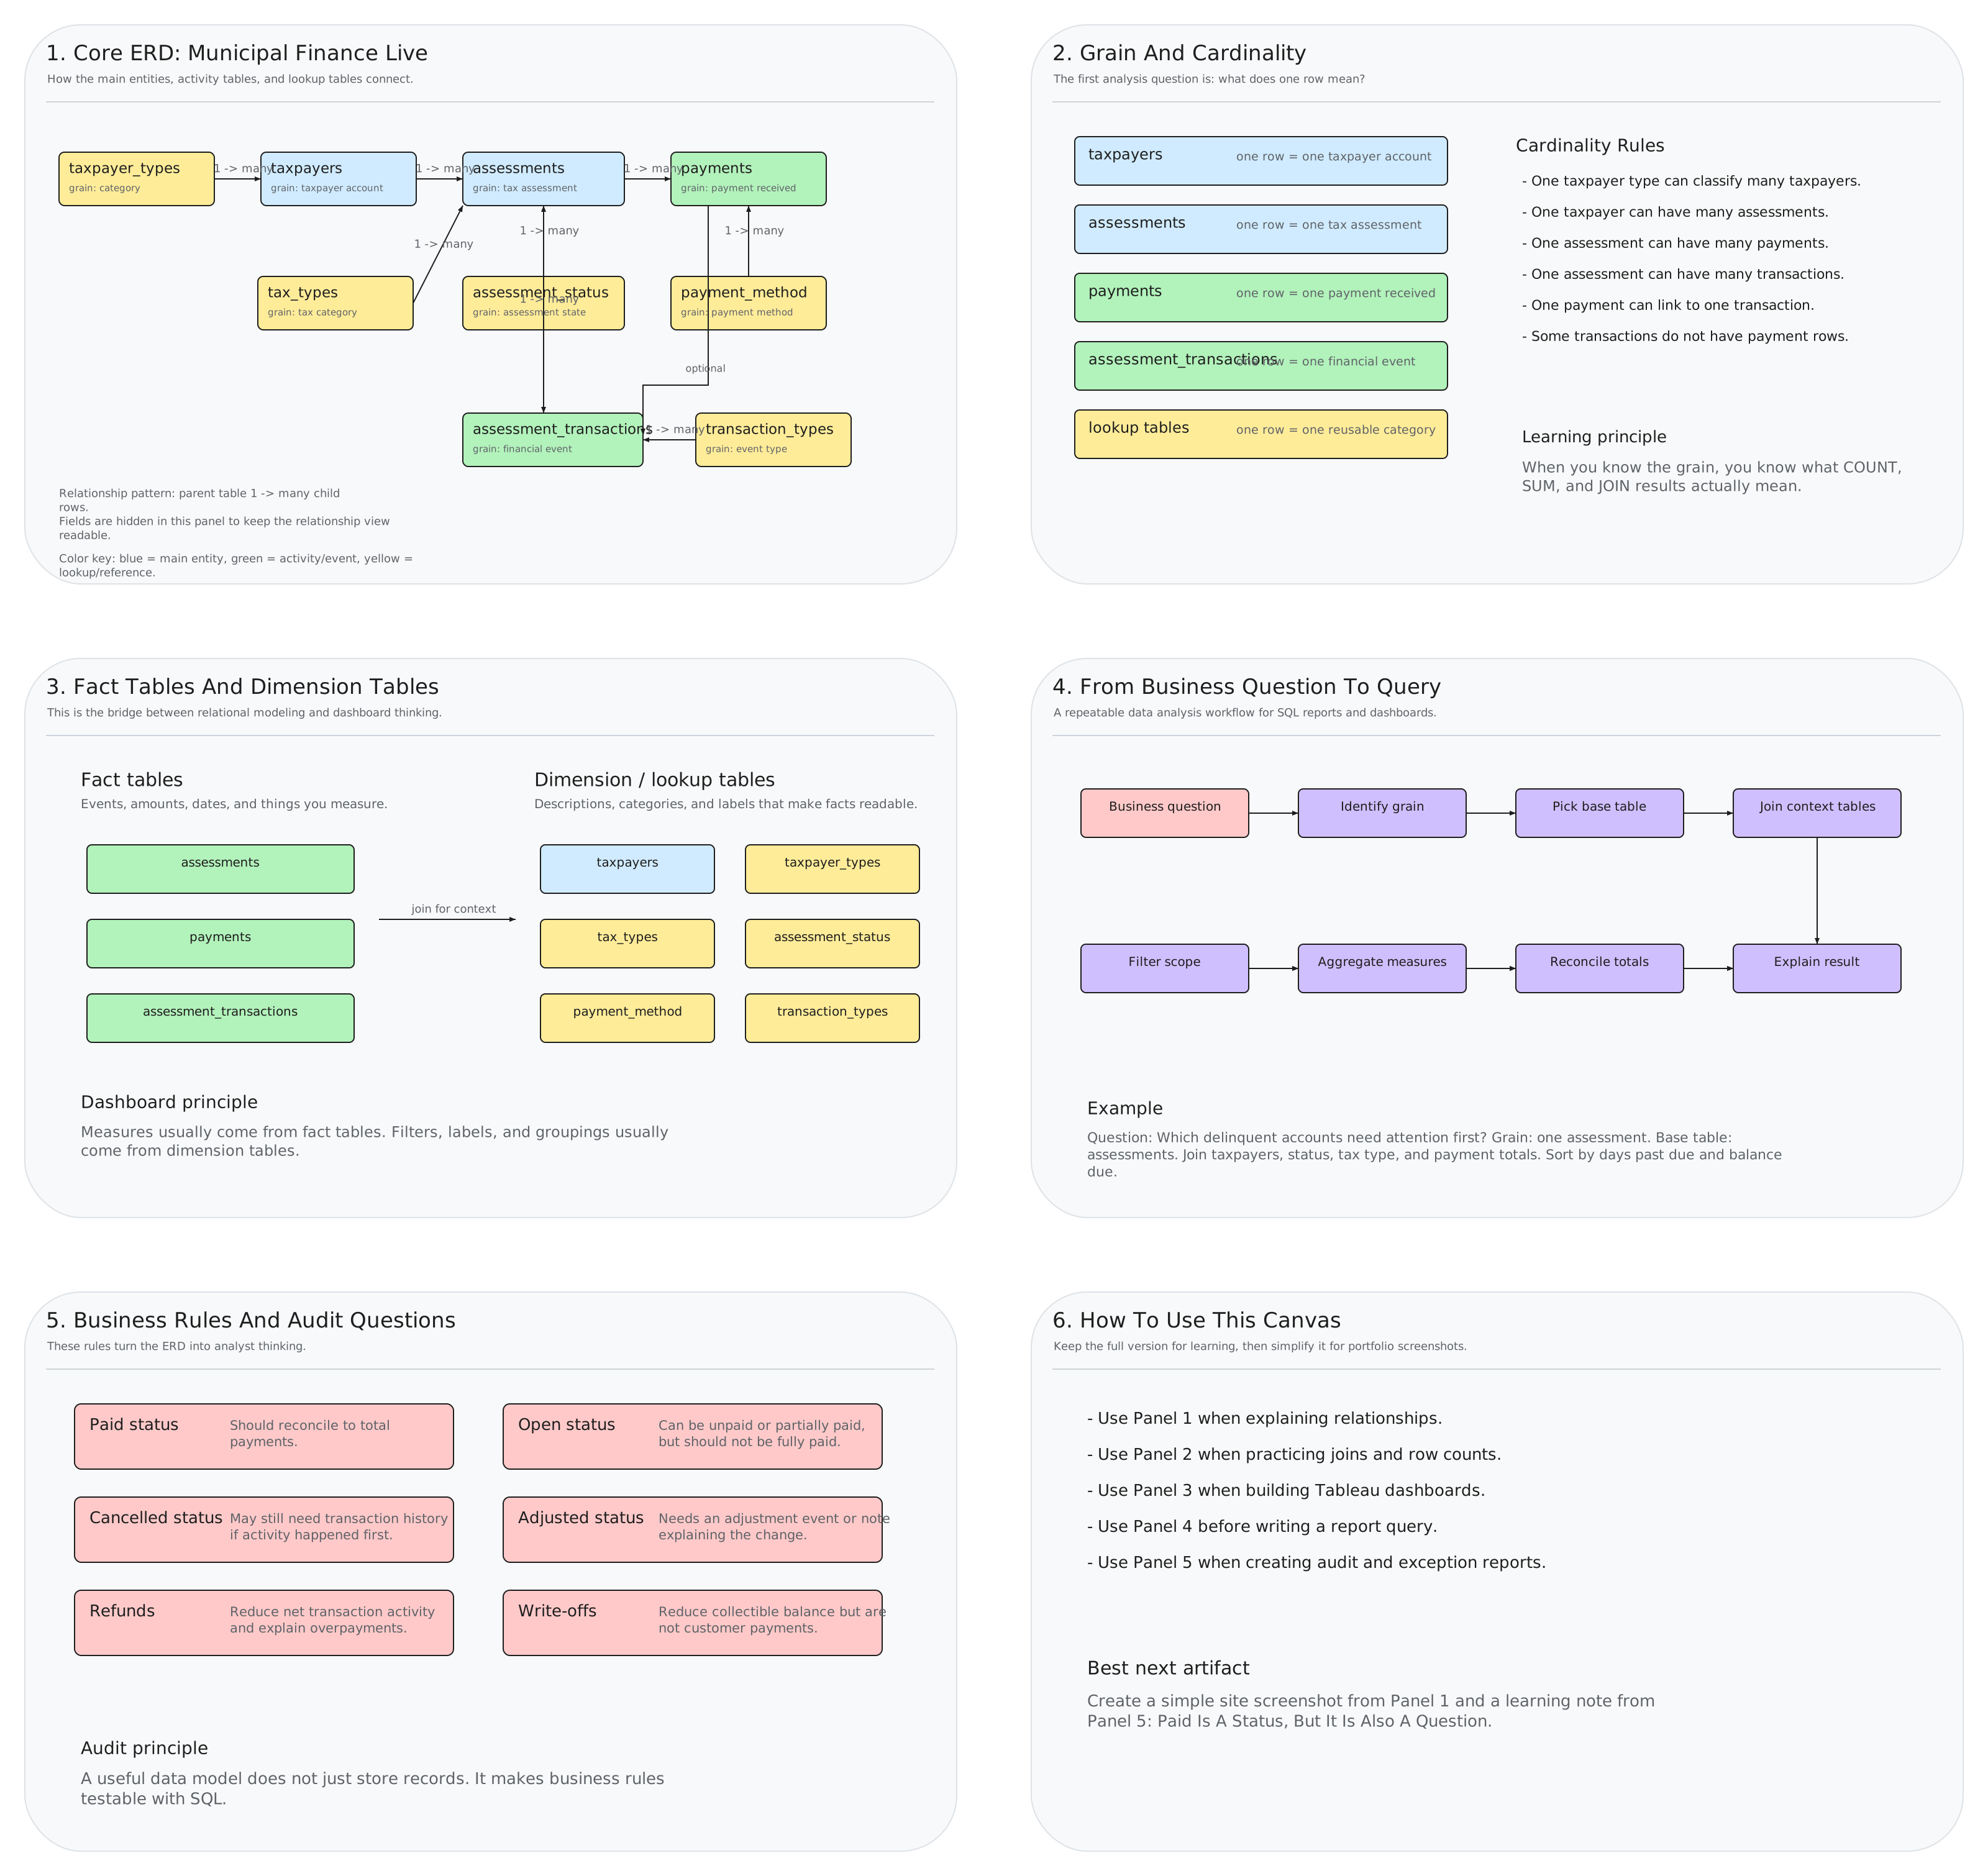
Things the system tracks, such as taxpayers and assessments.
Events and measurable activity, such as payments and transactions.
Reference categories that make reports readable.
Principle 1
Relationships: Tables Are Not Islands
An ERD shows how one table gives context to another. The most important relationship pattern in this project is one-to-many.
taxpayers -> assessments
One taxpayer can have many assessments.
assessments -> payments
One assessment can have many payments.
assessments -> assessment_transactions
One assessment can have many financial events.
Principle 2
Grain: What Does One Row Mean?
Grain is the meaning of one row in a table. If you do not know the grain, your counts, sums, and joins can become misleading.
taxpayers
One row = one taxpayer account.
assessments
One row = one tax assessment.
payments
One row = one payment received.
assessment_transactions
One row = one financial event.
Why this matters
If you count rows in payments, you are counting payments.
If you count rows in assessments, you are counting assessments.
Those are different business questions.
Principle 3
Fact Tables And Dimension Tables
This is the bridge from database design to dashboards. Fact tables hold measurable activity. Dimension and lookup tables describe that activity.
Fact-like tables
assessments: assessed amount, due date, tax yearpayments: payment amount, posted date, effective dateassessment_transactions: transaction amount and date
Dimension / lookup tables
taxpayers: account and taxpayer detailstax_types: tax category labelsassessment_status: status labelspayment_method: payment method labelstransaction_types: event type labels
Dashboard rule of thumb
Measures usually come from fact tables. Filters, labels, and grouping fields usually come from dimension or lookup tables.
Principle 4
Payments Are Not The Same As Transactions
This is one of the most important modeling decisions in the project. A payment is a transaction, but not every transaction is a payment.
Payments
Payments represent money received. They have payment methods, dates, amounts, and receipt numbers.
Transactions
Transactions represent financial events. They can include payments, adjustments, cancellations, refunds, and write-offs.
Principle 5
Business Rules Make The Model Useful
A useful data model does not just store records. It makes business rules testable with SQL.
- Paid status: should reconcile to payment totals.
- Open status: can be unpaid or partially paid, but should not be fully paid.
- Cancelled status: may still need transaction history if financial activity happened first.
- Adjusted status: should have an adjustment event or note explaining the change.
- Refunds: reduce net transaction activity and help explain overpayments.
- Write-offs: reduce collectible balance but are not customer payments.
Analysis Workflow
From Business Question To Query
When you do not know where to start, use this sequence.
Quick Review
Ten-Minute Study Prompts
- Explain what one row means in
assessments. - Explain why
tax_typesis a lookup table. - Describe the relationship between
taxpayersandassessments. - Describe the relationship between
assessmentsandpayments. - Explain why payments and transactions are separated.
- Name two business rules that SQL can test.
- Identify one measure that belongs in a dashboard.
- Identify one filter or grouping field that belongs in a dashboard.
- Write one business question this model can answer.
- Write one question you still have about the model.